
America 2030.
Diversified Resilience.
A five-year, short-term fund investing in six sectors at the foundation of U.S. resilience and sovereignty: Defense, Energy, AI Infrastructure, Robotics, Critical Minerals, and Space.
Available to accredited investors and qualified purchasers only.
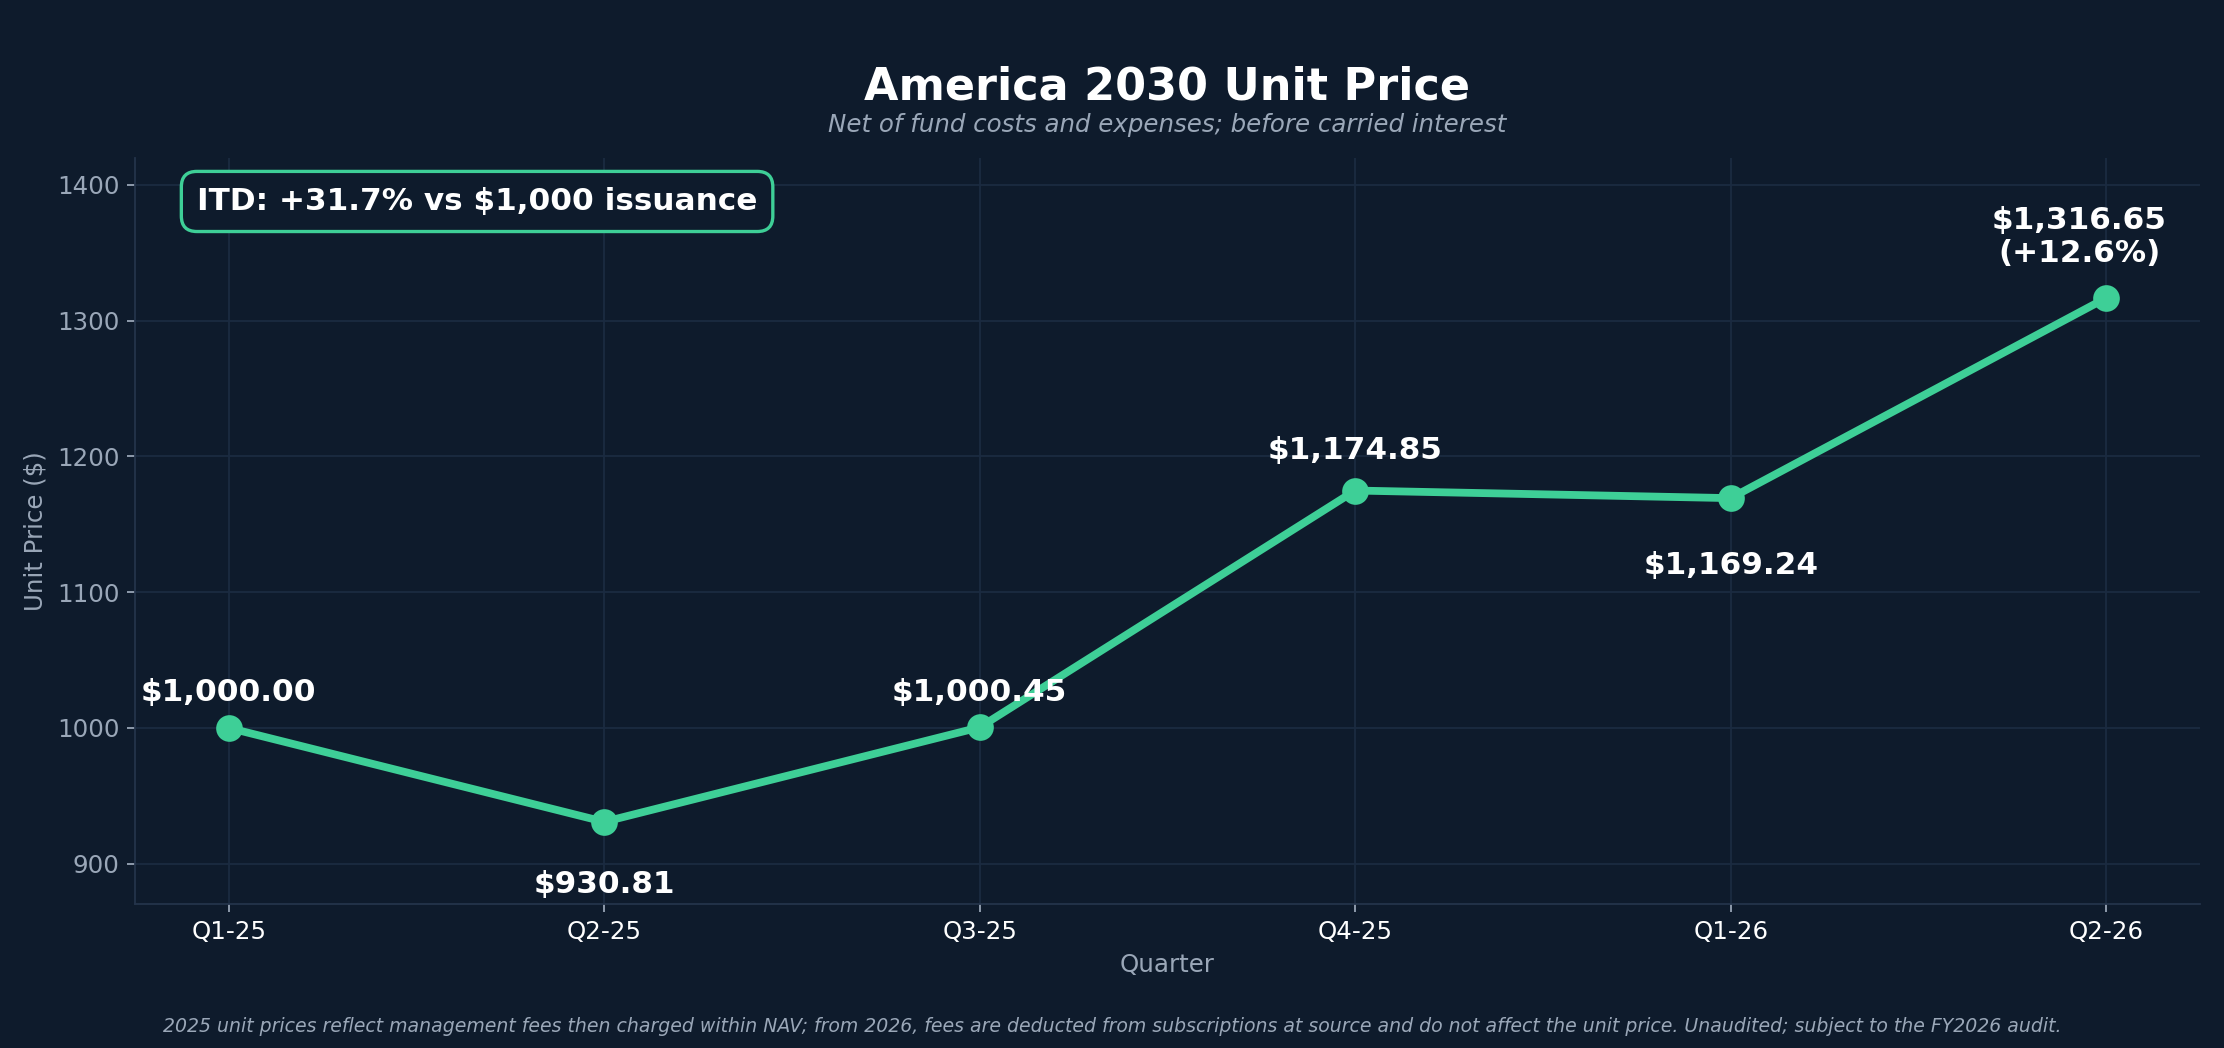
Past performance is not indicative of future results. Performance figures (Net TVPI and return since inception) reflect the Fund's internal, unaudited net asset value as of June 30, 2026, calculated in accordance with the Fund's valuation policy. Return since inception is the change in NAV per unit relative to the $1,000 issuance price. The most recent independently audited financial statements are for the year ended December 31, 2025. Performance is net of management, administration, and transaction fees, but does not reflect carried interest. Contributed capital and investor count are as of June 30, 2026. The Fund's target size is $50 million. Soft commitments are non-binding indications of interest, contingent on the Fund reaching $5 million in subscriptions.
Fee structure. Management fee of 1.5% per year is charged upfront for the full 5-year fund duration. Performance fee of 15% carried interest applies on a European-style basis after an 8% compounded annual hurdle. No further management fees will be charged on committed capital until the end of 2030.
Investments in private securities are speculative, illiquid, and involve a high risk of loss, including the potential loss of all invested capital. Not all private companies will experience an IPO or other liquidity event. This communication is for informational purposes only and is not an offer to sell or a solicitation of an offer to buy any security. Any offer of securities will be made only through definitive offering documents. Available only to accredited investors as defined in Rule 501 of Regulation D and, where applicable, qualified purchasers. All securities offered through IPO CLUB II LLC are sold under SEC Rule 506(c) of Regulation D. See full disclosures for additional information.
Key Facts
Minimum investment
$50,000
Management fee
1.5% / year (charged upfront)
Performance fee
15% carry European, 8% hurdle
Target duration
5 years (to December 2030)
IRA-eligible
Self-directed IRA accepted
Member Access
Review the Investment Memo
Enter the Data Room to unlock the full America 2030 investment memo, live SPV deals, and 120+ company reports.
- ✓ Full America 2030 investment memo
- ✓ Live SPV deals as they open
- ✓ 120+ company reports
- ✓ Club Letters & sector archive
Why America 2030
Exposure to late-stage private companies in six sectors at the foundation of U.S. resilience and sovereignty. Secondary-focused for later-stage entry. Short maturity aligned to exit timing.
Focused mandate
Six sectors at the foundation of U.S. resilience and sovereignty: Defense, Energy, AI Infrastructure, Robotics, Critical Minerals, and Space. Every position maps to a structural tailwind, not a cycle.
Short maturity
Five-year target duration to 2030. Underwriting discipline and exit expectations are built into the fund's structure, not left open-ended.
Secondary focus
Later-stage entry through secondary transactions. Companies with established traction, revenue, and in many cases a clear path to IPO. Reduced blind-pool risk.
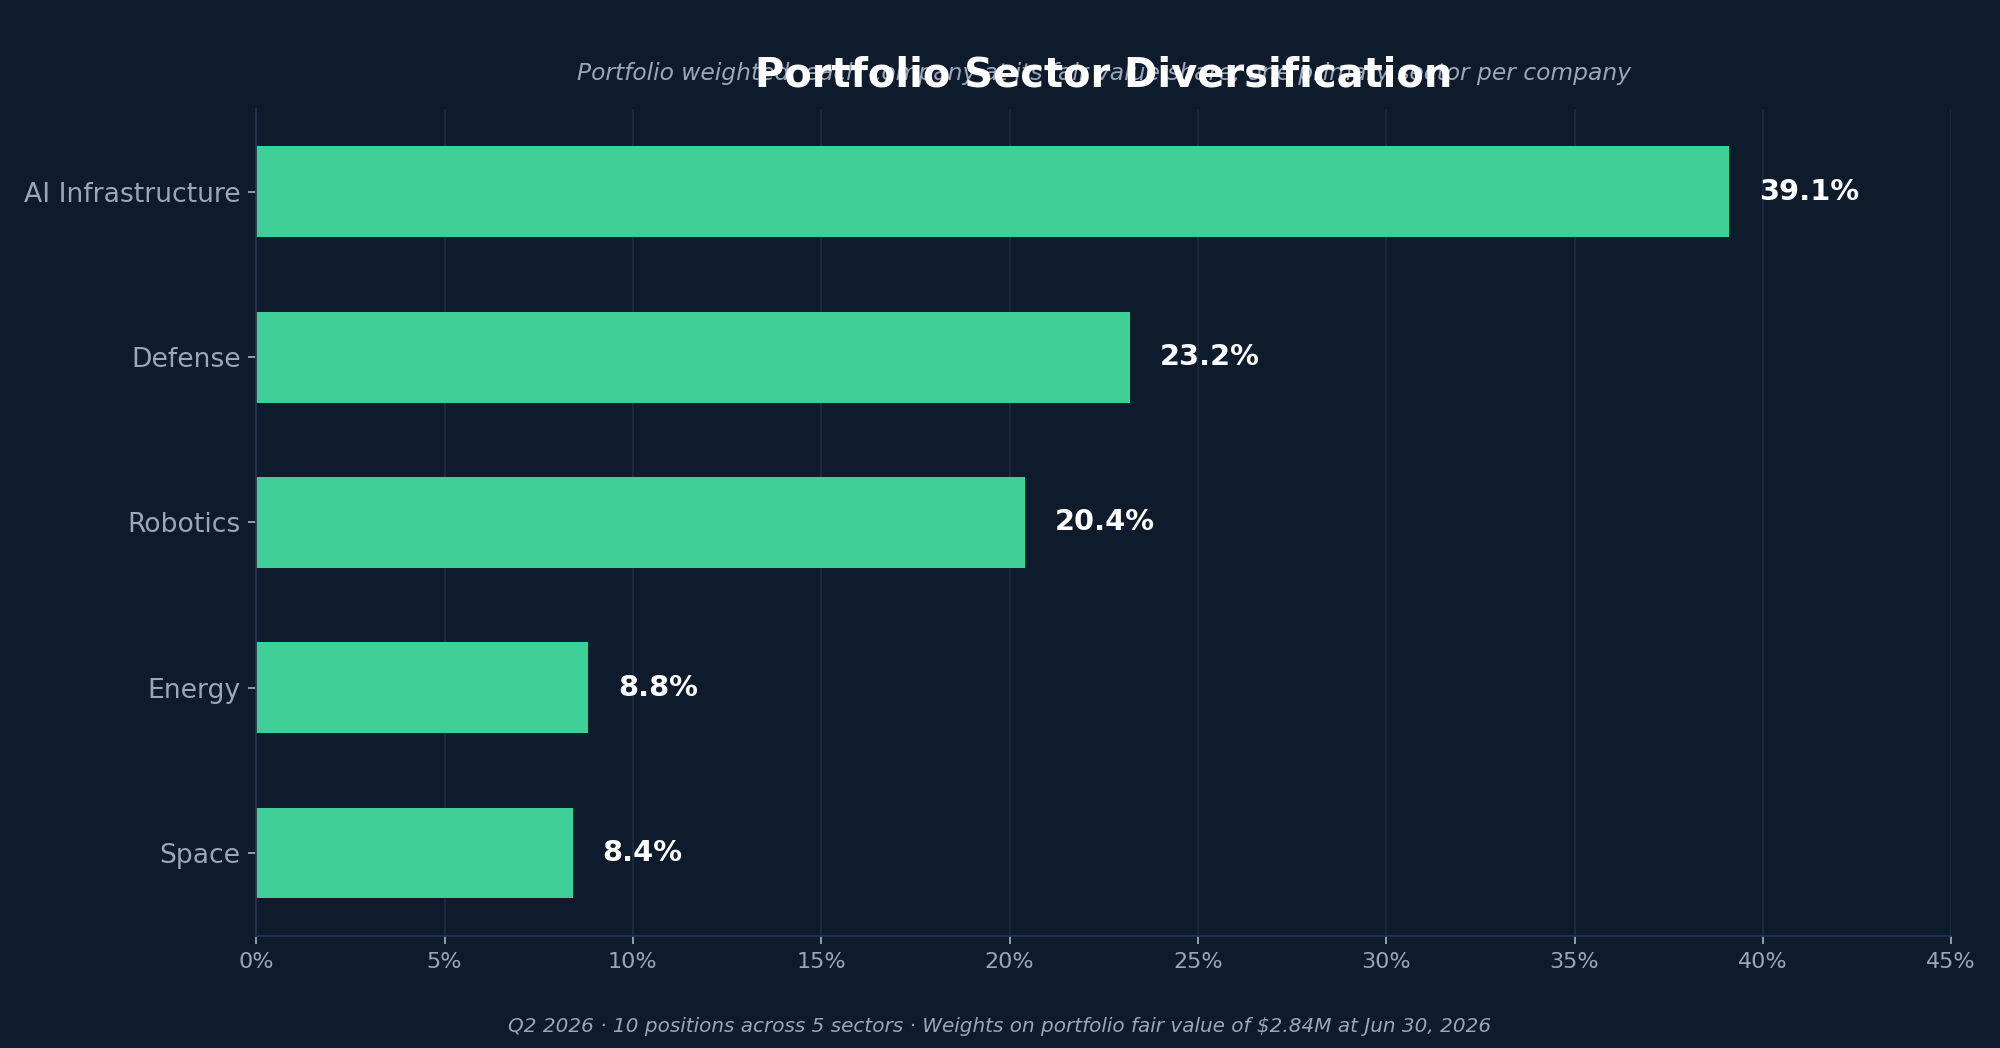
11 Positions Across 5 Sectors
Cap-table equity and direct secondary positions. No fund-of-funds, no blind pool.
Newcleo
SambaNova
Impossible Metals
Terradepth
Lightmatter
Allen Control Systems
Loft Orbital
Kodiak
Shotling
Redwood Materials
Shield AI
How it Works
Book a call
Schedule a short introductory call to confirm eligibility, walk through the fund structure, and determine whether America 2030 is an appropriate fit for your portfolio.
Review the investment memo
Access the full investment memo and supporting materials detailing strategy, fees, risks, and fund mechanics. Available immediately after entering the Data Room.
Subscribe online
Complete accredited investor verification and review subscription documents. Minimum investment of $50,000. Self-directed IRAs accepted.
Capital deployed through 2027
Capital is deployed throughout the life of the fund as secondary and follow-on opportunities are identified across our six sectors: Defense, Energy, AI Infrastructure, Robotics, Critical Minerals, and Space.
Returns distributed at exit
Capital is distributed to investors as exits occur, on or before December 2030. Short-maturity fund designed to align with the IPO cycle.
Rule 506(c) · Accredited Only
Request the deck.
The America 2030 fund deck: strategy, portfolio, terms, and track record. Sent directly to your inbox.
Request received.
Your request is with the manager for a quick review. The America 2030 deck will be sent to your inbox from members@ipo.club, typically within one business day. If you'd like to walk through it, the fastest path is a 15-minute call.